


Written by Avani Airan
The NITI Aayog recently introduced a first-of-its-kind School Education Quality Index (SEQI). The index provides a regular review of the quality of education across all Indian States and Union Territories.
SEQI was released following a 70-point Performance Grading Index (PGI) released by the Ministry of Human Resources Development (MHRD). The PGI provides insights on the status of school education in terms of outcomes as well as the driving forces for their performance, the inputs and processes. While the SEQI focuses primarily on outcomes alone, it bears significant similarities with the PGI, with 33 common indicators.
The NITI Aayog has stated that SEQI’s aim is to drive “tangible policy improvements towards achieving quality education in a coherent and collaborative manner”. It does this by focusing on outcomes in Indian education policies by providing credible regular assessments. SEQI also facilitates the sharing of knowledge and best practices across states and UTs, and provides useful insights for data-driven decision-making, including better targeting of policy interventions. Upon critical review though, concerns arise regarding the effectiveness of SEQI’s methods to achieve the same. If SEQI is to be successful, the shortcoming of the data sources it uses needs to be evaluated too.
Does the Data Hit the Mark?
The data for both indices have been sourced from the Unified District Information System for Education (UDISE), an educational management information system on key school-level indicators, the National Achievement Survey (NAS), a large scale assessment test conducted by the NCERT, and the information uploaded by the States and UTs on MHRD’s ShaGun portal. Since the system is geared towards learning, SEQI assigns almost half its weight to learning outcomes. The primary source for data on learning outcomes is the NAS 2017. The limitations of the NAS, which are plenty, severely affect the quality of SEQI results as well.
For starters, as mentioned even in the SEQI report, due to changes in test items and coverage and reporting scales, the learning outcomes data from NAS 2017 are not comparable with those from previous cycles. Furthermore, the scope of NAS is limited to students enrolled in Grades 3, 5, and 8 in government and government-aided schools only. It excludes several categories of children, such as those enrolled in private schools, unrecognized schools, and institutions of religious learning. Out of school children, as well as those children who are absent on the day of assessment get left out as well. This raises concerns for SEQI if the NAS continues to provide inconsistent or incomplete data.
Another source for the SEQI is UDISE, which has its own set of data issues and limitations, especially with regard to the collection and training of officials in charge. Additionally, UDISE is considered a status check on current infrastructure and human resources. It fails to highlight the quality or the usability of the infrastructure facility, and instead reports a mere ‘yes’ or ‘no’ on the availability of the structure.
Using such data for ranking then paints a very skewed picture of the actual quality of school education in India. For instance, if there were a girls’ toilet in the school without any running water, despite resulting problems in gendered access and infrastructure, the state/UT would achieve a higher rank than it deserves. In the end, this could prove to be detrimental to a state’s intended purpose of driving improvements in education outcomes.
Finally, while most indicators cover only the performance of Government-managed schools, a few cover all school types (Government, Government Aided and privately managed). Such asymmetry in the information affects the data inferences. The NITI Aayog has expressed hopes of increasing the data sample to include more data from private entities in the future. However, in the meantime, while it is a fair inclusion for indicators on enrollment ratios and transition rates, perhaps data from private schools shouldn’t be considered with respect to infrastructural standards in terms of girls’ toilets and computer labs, teacher availability and qualification, and self-assessment levels.
Evaluating SEQI’s Methods
NITI Aayog claims “SEQI focuses on indicators that drive improvements in the quality of education rather than on inputs or specific processes.” Currently, the index follows an outcomes-based approach with two categories of indicators ranked: the Outcomes, which include learning, access, infrastructure, and equity outcomes, and the Governance Processes Aiding Outcomes. The report also mentions that in the future, the linkages between policy actions and SEQI indicators will be analyzed to measure the efforts made by states and UTs to improve school education.
However, for meaningful solutions to be developed, data on the inputs that actually drive the outcomes, and on where those inputs are lacking is crucial in identifying the source of a problem. Including such indicators in the index could provide valuable information on why states’ performances improve or weaken, making the index a beneficial tool for policymakers. An explicit focus on outcomes alone may take away from the purpose of targeted policy interventions and the sharing of best practices.
The indicators themselves appear to be limited in other ways as well. The learning outcomes are based entirely on information gathered via the National Achievement Survey (NAS) for grades 3, 5 and 8, which doesn’t give a complete view of the effectiveness of schooling.

This leaves out other essential details on infrastructural standards and how the absence of facilities affects the enrollment and transition rates. When states are ranked on the basis of such limited information, it is a risky endeavour to expect policy reforms as a result of SEQI.
With regard to Equity Outcomes, input-related indicators, such as the provision of entitlements, are not looked at. Instead, SEQI discusses the difference in learning outcomes between children from vulnerable sections and those from the General Category through absolute values, while being neutral to the direction of the difference. For P.S. Krishnan, an expert in the field, the ‘neutrality’ adopted in the report when discussing the differences between SCs, STs, OBCs, men, women, etc., deprives policymakers the opportunity to identify gaps and derive meaningful corrective measures. “Neutrality is important if there is no inequality,” says Krishnan, highlighting the importance of knowing how the gap is reducing or widening.
Just How Useful is SEQI?
The SEQI was released following the MHRD’s PGI, yet when compared, questions arise regarding the former’s utility and aims. The PGI is a comprehensive study with 70 indicators-including both inputs and outcomes-which SEQI has borrowed a large chunk of for its own rankings. Plans to provide a separate kitty of funds to incentivise policy decisions based on PGI rankings are also under review.
On the other hand, the NITI Aayog’s SEQI incentivizes policymakers through a “measurement of quality-related education outcomes” and initiatives such as the Sustainable Action for Transforming Human capital – Education (SATH-E). This only emphasises the need for innovative policy design, as opposed to actually incentivising it.
If the NITI Aayog continues to release the SEQI without addressing these limitations in both, the PGI, a more comprehensive index, could render it redundant.
Even the method of ranking states needs careful reassessment with regard to regional intricacies. In order to facilitate like-to-like comparisons, the index groups States and UTs under 3 broad heads of Large States, Small States and UTs. Such broad categories fail to account for other specific factors that affect the education system in a specific state. A more nuanced categorisation would ensure that states’ performances are fairly pitted against one another, making SEQI a fairer and more useful evaluation.
Furthermore, the states and UTs are ranked on their progress as well, that is, on the change in their performance between SEQI’s reference year (2016-17) and the base year (2015-16). However, just like the controversial time window considered in the Health Index released by NITI Aayog, the SEQI also bases rankings of “most improved” and “less improved” states on an extremely small window of one year.
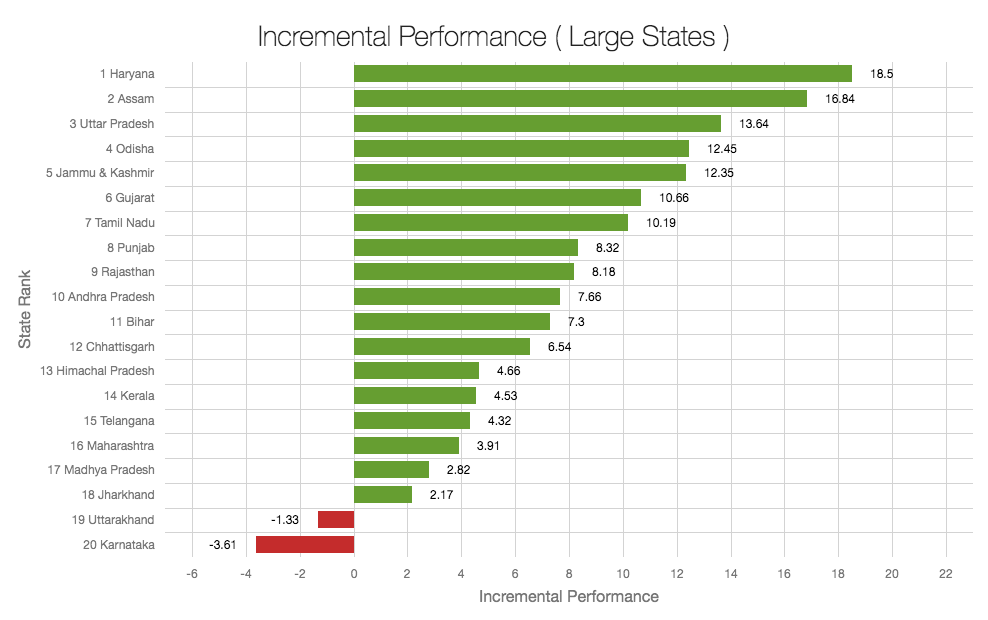
The data in the SEQI report reflects that most states have shown commendable improvement between the base and the reference years. However, considering that learning or infrastructural outcomes can hardly have such a high intervention to response rate in only a year, the conclusions drawn on incremental performance must be understood with caution. Such short-duration data points can lead to grossly misleading inferences.
The Way Ahead
The SEQI is a well-intentioned attempt by the NITI Aayog to provide states’ a platform to identify their strengths and weaknesses and undertake requisite policy interventions. However, for it to be truly useful to policymakers and reach its full potential, the purpose which it seeks to serve needs to be kept in mind first. If improving education in a cost-effective manner is its purpose, then better data, better methods, and more nuanced indicators on inputs are required to drive much-needed education reforms.
Featured image courtesy NITI Aayog.
![]()


[…] You May Also Like: Can the NITI Aayog’s School Education Quality Index Effectively Evaluate Indian Education? […]